General Guidelines
Desktop/Web
- Browser Support
- Windows
- Installers
- Consoles
- Dashboards
- Workspaces
- Navigation
- Forms
- Validation
- Error Messages
- Labels/Required Fields
- href="forms-inline-messaging.php">Inline Messaging
- Edit in Place
- Status/Progress Indicators
- Tab Indexes
- Input Prompts
- Selection
- Disabled Fields
- Structured Format
- Search
- Grids/Tables
- Dialog Boxes
- Modals
- SuperBox
- Wizards
- Messages
- Progressive Disclosure
- UI Controls
- UI Text (IDD)
- Data Visualization
Mobile (Tablet & Phone)
- Resolutions
- Gestures
- Touch
- UI Controls
- Buttons
- Check Boxes
- Color Picker
- Date Picker/Calendar
- Drop Down List
- Combo Box
- Groups and Separators
- Links
- List Boxes
- Progress Indicators
- Radio Buttons
- Scrollbars
- Sliders
- href="mobile-snap-drag-controls.php">Snap-Drag Controls
- Spin Controls
- Status Indicators
- Text Boxes
- Toolbars
- Screen Orientation
- Page Composition
- Display of Information
- Control and Confirmation
- Revealing More
- Widgets
- Input and Output
- Input Method Indicator
- Autocomplete and Prediction
- href="mobile-directional-entry.php">Directional Entry
- Press and Hold
- Focus and Cursors
- Input Areas
- Form Selections
- Mechanical Style Controls
- Clear Entry
- Tones
- Voice Input
- Voice Readback
- Voice Notifications
- Haptic Output
Visual Design Guidelines
Data Visualization - Topologies
Overview
Topologies receive large amounts of information about an IT environment. Data is usually stored in multiple locations including remote datacenters, local relational databases and cloud data storage services, and it is accessed via multiple SQL operations and requests to remote Web services. The accuracy of this visualization depends on how effectively the back-end data-handling components can discover, gather, consolidate and validate infrastructure information from multiple sources. Delays introduced by the data gathering process, such as through network traffic or outages, will cause users to work with outdated information and therefore negatively impact their work.
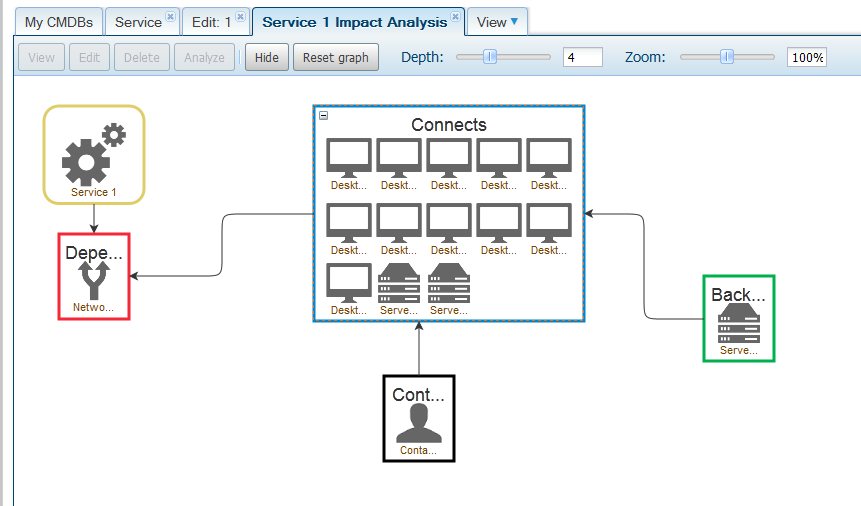
The ease of data exploration also affects the usability of visualizations. Usable visualizations provide tools for users to explore the data in ways that are meaningful to them. Data filters are exploration tools offered by most visualization systems. They allow users to select the subsets of the data they want to visualize. Two other representative exploration tools offered by topology infrastructure visualizations are impact analysis and root cause analysis. The results from these analysis tools highlight relevant dependencies between elements.
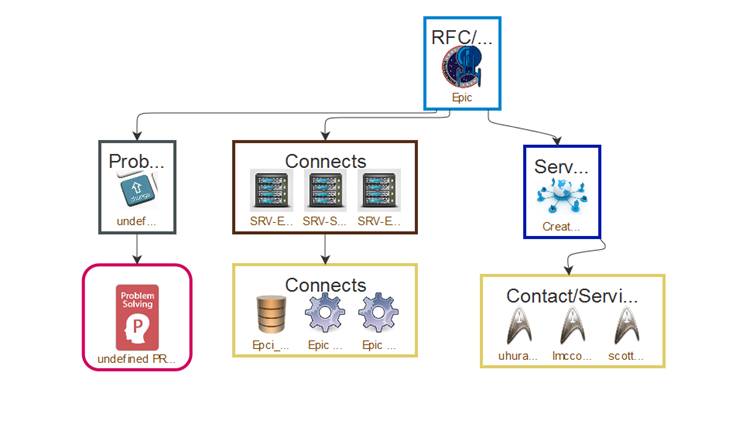
Computer-based visualization systems are real-time interactive technologies that encourage users to actively control multiple aspects of the visual representation of information. Topology visualizations allow users to emphasize relationship patterns in the topology by providing multiple layout styles to display large amounts of data while maintaining interactive response times.

